

Every Indian IT manager managing a remote or hybrid team faces the same measurement problem: the instinct is to track hours worked, but hours worked is one of the least useful measures of software team productivity. A developer who spends 9 hours in meetings and context-switching is "working" the same number of hours as a developer who ships 3 features in focused work blocks. The hours are the same. The output is not.
Employee productivity report software solves this by generating structured, data-driven reports on what teams actually produced — tasks completed, sprint velocity, billable hours by client, and attendance patterns — rather than just how long employees were at their computers.
For Indian IT companies managing remote teams across Bengaluru, Pune, Hyderabad, Delhi, and Chennai, the ability to generate accurate productivity reports matters for three reasons: client billing (proving what was done in which hours), internal team management (identifying blockers and imbalanced workloads), and compliance (demonstrating working hours and leave records under the new Labour Codes).
Why "Hours Worked" Is the Wrong Metric for Indian IT Teams
The most common productivity tracking mistake in Indian IT companies is equating presence with productivity — measuring how long someone is logged in and calling it a productivity report.
Hours worked is a useful floor measure (an employee consistently working 4 hours when contracted for 8 is a signal worth investigating), but it tells you nothing about:
- Whether those hours produced something of value
- Whether the right tasks were worked on (high-priority sprint tickets vs low-priority admin)
- Whether a developer's time is being lost to meetings, context-switching, or unclear requirements
- Whether client-billable hours are being correctly captured and separated from internal work
Indian IT companies lose an estimated 15–25% of billable hours to incorrect time attribution — hours that were worked on client projects but logged against internal tasks or not logged at all. Over a year of client delivery, this represents a significant revenue leak.
The 5 Metrics That Actually Measure IT Team Productivity
Metric 1 — Sprint Velocity (Tasks Completed per Sprint)
Sprint velocity measures how many story points or tasks a team completes in each sprint. Tracked over time, it shows whether a team is improving, stable, or declining in delivery capacity.
For Indian IT teams doing Agile project delivery, sprint velocity is the most reliable signal of team health. A team consistently completing 80% of its sprint commitment is performing well. A team consistently completing 45% is signalling one of three things: over-commitment in sprint planning, blocked tasks (a dependency issue), or team capacity problems (unplanned leave, too many parallel projects).
Sprint velocity reports should be generated automatically at sprint close — not compiled manually from individual task updates.
Metric 2 — Billable Hours Ratio
For client-delivery IT companies, billable hours ratio measures what percentage of each developer's working time is actually charged to a client project versus spent on internal work (training, internal tools, admin, meetings).
Billable hours ratio = (Client-billable hours ÷ Total working hours) × 100
A healthy ratio for an Indian IT service company is typically 70–80%. Below 65% signals that too much team time is going to internal overhead. Above 90% signals that the team has no capacity buffer and is at high burnout risk.
Metric 3 — Task Completion Rate per Person
Task completion rate measures what percentage of tasks assigned to each team member are completed on time versus delayed or rolled over to the next sprint.
This metric identifies individual blockers that are invisible at the team level. A developer with a 40% task completion rate is not necessarily underperforming — they may be getting assigned tasks that are too large (need breaking down), or they may be a blocker magnet (tasks that require others to unblock them). The report surfaces the pattern; the manager investigates the cause.
Metric 4 — Attendance and Leave Patterns
Productivity is directly affected by availability. An IT team with 30% of its capacity on unplanned leave in a sprint will miss its velocity targets regardless of individual performance. Attendance reports that show leave patterns by team, by week, and by leave type (planned vs unplanned) give managers the data to adjust sprint commitments before the sprint starts rather than discovering the capacity gap mid-sprint.
Under the OSH Code 2020 (in force from November 21, 2025), companies must maintain accurate working hours records. Attendance reports are now both a management tool and a compliance document.
Metric 5 — Time Distribution by Task Type
Time distribution reports break each developer's hours into categories: client-billable feature development, bug fixing, code review, meetings, admin and communication, and blocked waiting time.
For most Indian IT teams running this report for the first time, the discovery is that meetings and admin consume 25–35% of total working hours — significantly more than managers estimate. This is the data that justifies reducing meeting frequency, introducing async communication norms, or shifting to more efficient sprint ceremonies.
What a Weekly Productivity Report Should Include for Indian IT Companies
A practical weekly productivity report for a 10–30 person Indian IT company should cover:
| Section | What it should show |
|---|---|
| Team summary | Total active hours this week (excluding idle time) vs contracted hours. Sprint completion percentage — what percentage of this sprint's tasks are done vs planned. Any tasks in Blocked status and how long they have been blocked. |
| Individual breakdown (for each developer) | Hours logged vs contracted hours. Tasks completed vs tasks assigned. Client-billable hours vs internal hours. Any leave taken and its type (CL, EL, comp off). |
| Project summary (per active project) | Hours consumed this week by project. Hours remaining in current sprint estimate. Variance from sprint plan — is this project running ahead, on pace, or behind? |
| Leave and attendance | Who is on leave next week and what is the impact on sprint capacity. Any unplanned absences this week and whether tasks were reassigned. |
Generating this report manually from time tracking spreadsheets, leave records, and task management data typically takes 2–3 hours per week. Generating it from an integrated platform takes zero hours — the report is available in real time.
How to Generate Productivity Reports Without Manual Work
The manual productivity reporting process in most Indian IT companies looks like this: the project manager exports time logs from Hubstaff or an Excel timesheet. They export task status from Jira or Trello. They cross-reference with the HR system for leave data. They compile everything into a Google Sheet and share it in the Monday standup.
This process takes 2–3 hours every week, is prone to errors when different systems have conflicting data, and produces reports that are already 24–48 hours stale by the time anyone reads them.
Integrated employee productivity report software eliminates each of these steps:
- Time tracking is connected to tasks — no export required. When a developer logs 2 hours against Sprint Task #247, that time is simultaneously attributed to the client project, the sprint, the developer's personal time log, and the payroll attendance record.
- Leave data is in the same system — no cross-referencing required. When a developer takes a CL day, it is recorded, approved, and reflected in the capacity calculation automatically.
- Reports are generated in real time — no compilation required. Project managers can view the sprint dashboard, individual productivity view, or attendance summary at any point during the week, not just on Monday morning after 2 hours of data preparation.
How TrackPM Generates Productivity Reports for Indian IT Teams
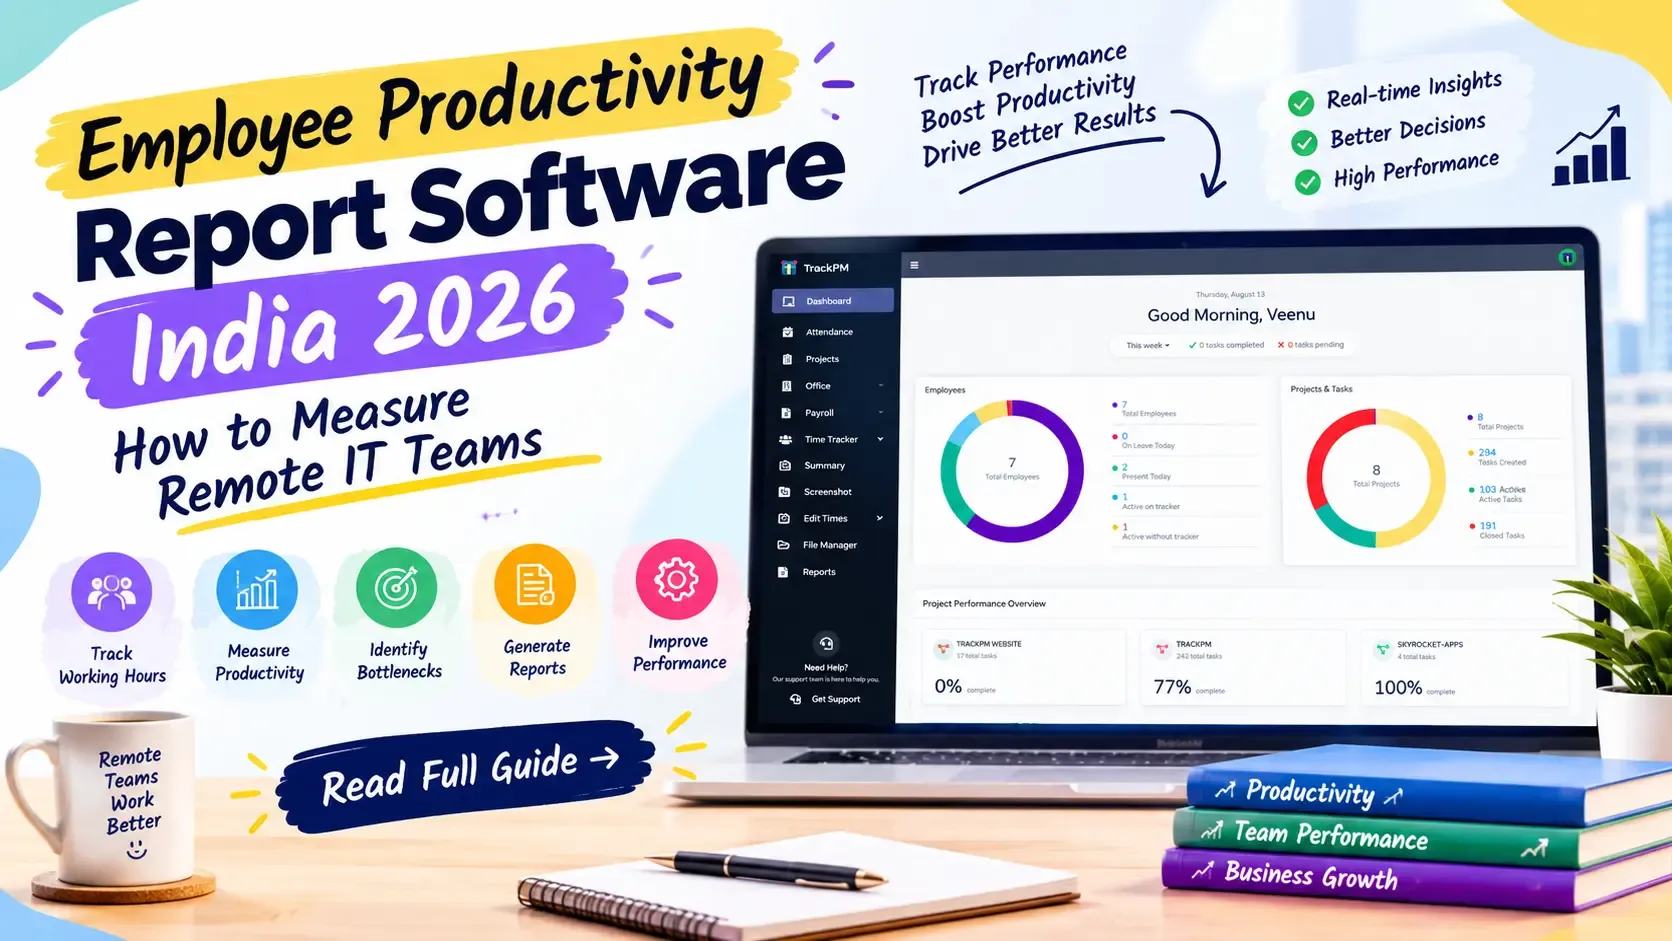
TrackPM's reports module connects time tracking, task management, and attendance data to generate productivity reports automatically.
Available reports include: sprint velocity by team and by sprint, individual task completion rate, time distribution by task category and client project, billable vs non-billable hours ratio, attendance summary with leave breakdown (CL, EL, LOP, comp off, SL), and payroll-ready time and attendance summaries for PF and TDS calculation.
Reports update in real time. Project managers can filter by team member, date range, project, client, or sprint. Export formats include PDF for client sharing and Excel for internal finance review.
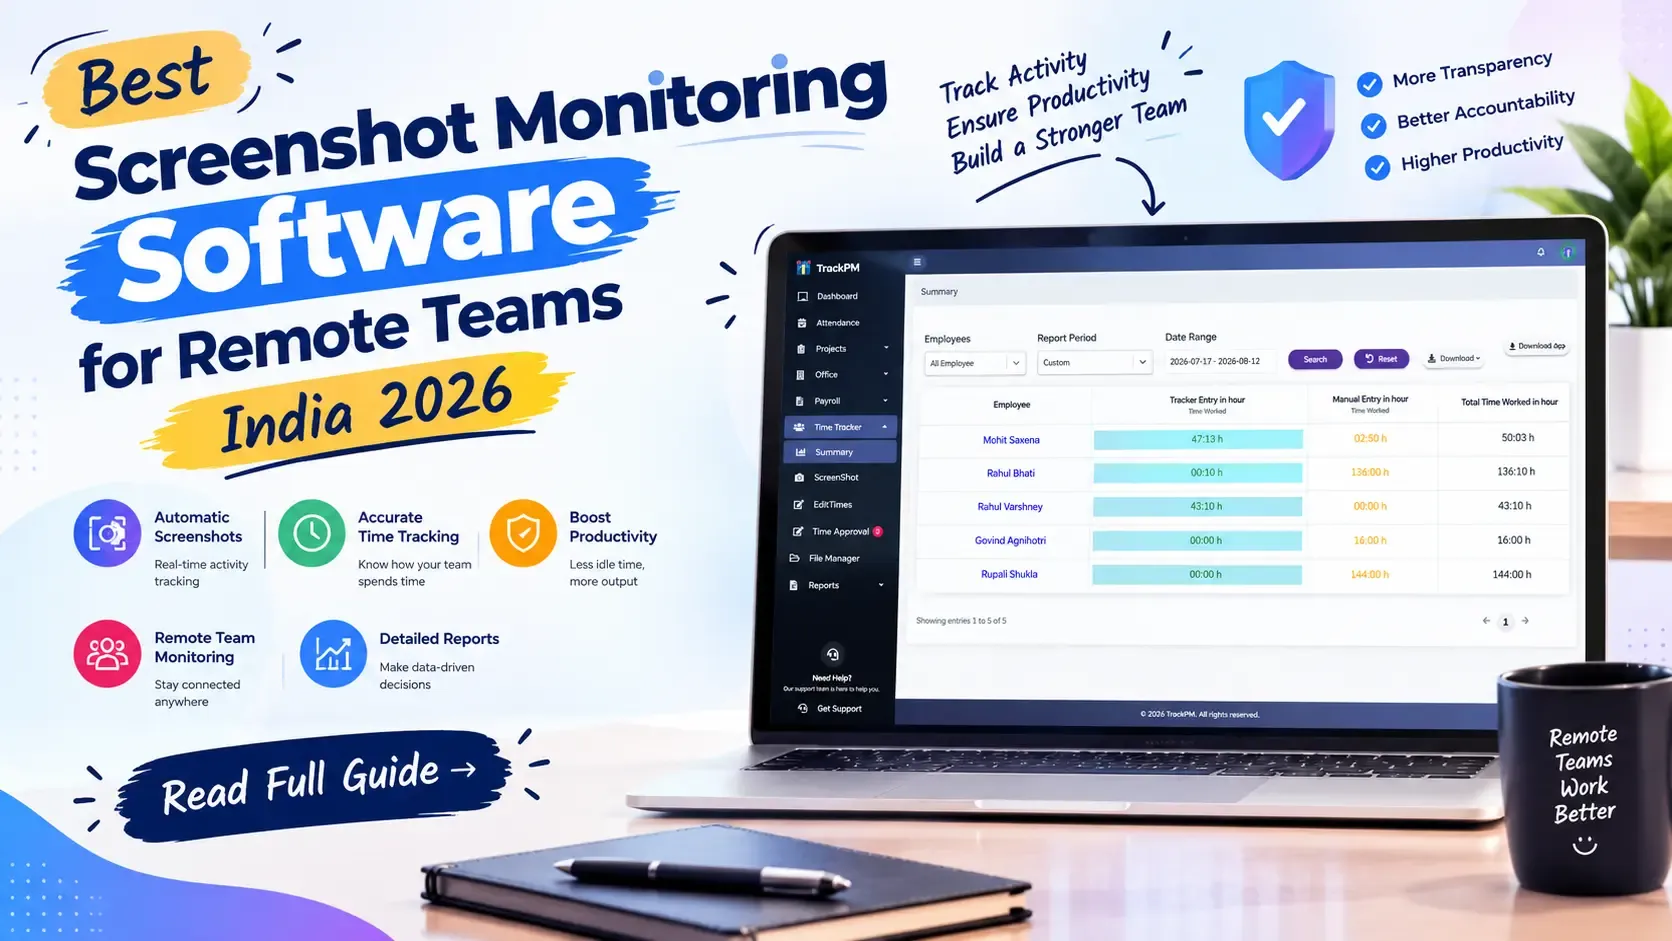
For Indian IT companies billing clients by the hour: TrackPM generates client-facing time log reports that show task-level hour attribution, screenshot evidence for any disputed billing period, and cumulative hours by project phase — removing billing disputes before they start. All of this runs on the same data as TrackPM's time tracking.
Frequently Asked Questions
What is employee productivity report software and why do Indian IT companies need it?
Employee productivity report software automatically generates structured reports on team output — tasks completed, hours worked by project, sprint velocity, billable hours, and attendance patterns. Indian IT companies need it for three reasons: client billing accuracy (proving which hours were spent on which client work), internal team management (identifying blockers, imbalanced workloads, and capacity problems), and Labour Code compliance (the OSH Code 2020 requires documented working hours records). Manual report compilation from spreadsheets and separate systems typically takes 2–3 hours per week and produces stale data; integrated software generates the same reports in real time.
What metrics should an employee productivity report include for an Indian IT company?
A practical productivity report for Indian IT companies should include: sprint velocity (tasks completed per sprint, tracked over time), billable hours ratio (client-billable hours as a percentage of total working hours — target 70–80%), individual task completion rate per developer, attendance and leave patterns (planned and unplanned leave by team and by week), and time distribution by task type (feature development, bug fixing, meetings, admin). Hours worked alone is insufficient — it measures presence, not output.
How does employee productivity report software connect to payroll for Indian IT companies?
In an integrated system, time tracking data feeds directly into payroll. LOP (loss of pay) deductions are calculated from the attendance record in the same system. Overtime hours are flagged for calculation under the Code on Wages 2019. Approved leave reduces LOP deductions automatically. The payroll-ready attendance summary is generated from verified time tracking data with no manual export or reconciliation. This eliminates the 1–2 day monthly reconciliation process that most Indian IT companies currently perform manually.
Can productivity reports be shared with clients for billing verification?
Yes. Productivity report software that tracks time at the task level can generate client-facing reports showing which tasks were completed, how many hours each consumed, and (in tools with screenshot monitoring) screenshot evidence for any disputed billing period. These reports are formatted for client review — typically showing date, task name, hours logged, developer name, and cumulative totals by project phase. This level of billing transparency is increasingly required by enterprise and government clients in India.
What is a healthy billable hours ratio for an Indian IT service company?
A healthy billable hours ratio for an Indian IT service company is typically 70–80% of total working hours. Below 65% suggests too much team time is going to internal overhead — training, internal tools, admin, and unproductive meetings. Above 90% indicates the team has no capacity buffer and is at high burnout and quality risk. The ratio should be tracked per team and per developer, not just company-wide, because individual ratios vary significantly based on role (senior developers tend to have lower ratios due to more code review and mentoring time).
Conclusion
Measure what your remote IT team actually delivers — not just how long they were logged in.
Start Free Trial — No Credit Card Required · See TrackPM's Report Features · See TrackPM's Time Tracking